Are you an Excel wizard? Are you able to take a glance at a spreadsheet the size of the Mall of America and extract valuable insight and conclusions from it? If you are, and perhaps recently competed in the World Excel Championship in Las Vegas, I have some .csv files I would love for you to take a look at! Or, you may be like me, where you can mold a data sheet to support a conclusion only after many hours of manipulation, repeatedly hacking pivot tables and VLOOKUPs together like a caveman using primitive tools. I’ve always thought it’s much easier to feed data into a visualization tool that gets me to that conclusion. That’s why so many big companies have a long standing subscription to PowerBI or Tableau, two of the biggest data visualization platforms in the market. Report-generating tools allow anyone from an entry level business analyst to a CEO to create executive reports that tell a story and influence decisions, without spending much time in more complicated tools like Excel or Snowflake.
QL2 generates retail product match files each day that typically contain over one million rows of data across all of the customers that we serve. Each morning, our average customer is greeted with a fresh multi-megabyte mound of data filled with over 40,000 rows of product price comparisons eager to be reviewed for price adjustments. Even several pricing analysts working together would have difficulty pulling every SKU-based insight out of that file in a day before clearing the runway for the next file delivery. Fortunately, many of our partner retailers have dedicated reporting teams that are able to spin up impressive internal dashboards and KPI tracking tools based on the match files. This is the best case scenario for extracting value from these files, rather than trying to manually wrap their hands around a preponderous file, they automate the processing and analysis of the file so that the most pressing price updates happen first.

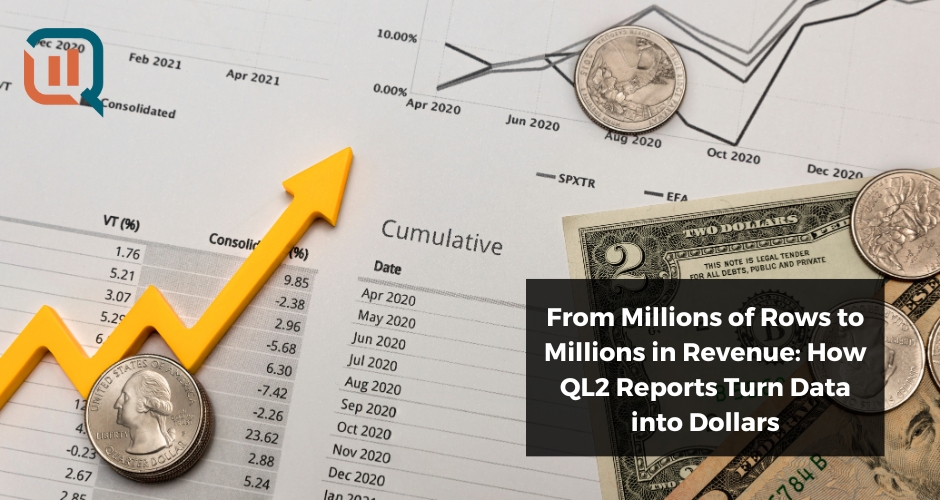
But it’s certainly not the case that without your own data visualization resources, QL2’s diamond-studded match files will remain impregnable and impossible to use! We have a host of users that successfully extract the competitive data to set their price without additional tools of their own. That’s because they employ QL2’s in house retail reports to focus on segments of data to suit their needs. Built using Tableau, we provide a suite of reports reviewing everything from category level insights to CPI comparisons across competitor websites.

Because of Tableau’s inherent flexibility, many of these reports can be customized to meet unique requirements. For example, one of our customers maintained an internal unique identifier code that indicated their SKUs that should never be out of stock. They requested this parameter be integrated into the QL2 reports so that they could use it as a data filter.
QL2 is not a retailer itself, so our reports aren’t built to answer every requirement a retailer may have. Each company and industry are different, and the out of the box reports are meant to be generally relevant to all of them. But because of our experience working across a variety of industries, we’ve found the key data points that are universally sought after, and have made visualizations of those data points standard. Competitive data is only useful if you can actually extract value from it, and make pricing decisions that lead to revenue opportunities. Utilizing QL2’s standard reports while investing in building out internal data dashboard capabilities is the recipe for success to generate exponentially increasing revenue opportunities from the pricing data.
Contact us today to get an in depth look at our in house reporting suite and discuss how it can empower you to make optimal pricing decisions!

Helping product/merchandising teams identify pricing gaps to maximize sales and profitability.