In Part 1 of this blog series, we defined the business questions that we were going to answer, prepared the data for the analysis, created the necessary features, and decided on the data grain to perform the analysis on.
Exploratory Data Analysis (EDA)
In this blog, we are going to answer those business questions using visual exploratory analysis and regression analysis. Exploratory data analysis is the first step. It involves analyzing and understanding the data to discover patterns, check assumptions, test hypotheses, and understand the data distributions using summary statistics and visual representations.
For this analysis, we will focus on the variables of the number of cars sold, time to sell, mileage, and price to help us understand the general trends.
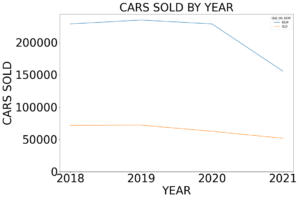
Number of cars sold
We can see that there is a sharp decline in the cars sold in 2021. This can be attributed to the shortage of inventory in the car market. When we split this by the number of old (>3 years old) vs new (<=3 years old) cars, we can see that the sharp decline can mostly be attributed to the new cars.
Time to sell
The time it takes to sell a car has increased in 2020, before coming back down in 2021. This could be attributed to the higher prices as well as the models being so popular that sellers may be holding on to them for a longer period.

Mileage
The mileage for old and new cars decreased in 2020 and 2021. The drop for old cars is sharper, which is expected because the cars might have been driven around less frequently. The difference in mileage of old and new cars has also decreased over time.

Price
Unsurprisingly, the price of old and new cars increased in 2020 and 2021. The distribution of prices is also much wider in 2021 compared to previous years. Price increases may be attributed to consumer demand, inventory issues, chip shortages, or a combination of reasons. (See here and here for more information.)

Regression Analysis
Regression analysis enables us to quantify some of the statements we made previously. Additionally, it can also be used to understand the relationship between the independent and the dependent variables.
Since the primary goal of the analysis is to understand the impact or influence of different factors on the price of the vehicles over time, the price will be the target variable or the dependent variable in this case. All the other variables will be our dependent variables.
The regression equation that we’ll be using for our analysis is:
PRICE ~ C(YEAR_SOLD) + C(YEAR_SOLD):C(OLD_OR_NEW) + C(YEAR_SOLD):C(OLD_OR_NEW):MILEAGE
- YEAR_SOLD, OLD_OR_NEW are categorical variables
- MILEAGE is a continuous variable
Combining various variables allows us to understand the interaction between variables and get a better understanding of what is happening.
Results & Conclusions
Here are the results from the regression analysis:

Note: The reference for the YEAR_SOLD is 2018 here. Therefore, all the interpretations are concerning a new car (<3 years old) in 2018.
Let’s understand how to interpret the coefficients:
- C(YEAR_SOLD)[T.YEAR] shows price change for each year with a new car (<3 years old) in 2018 as the baseline. This takes into account the external factors such as demand, inventory, seasonality, etc. for variables that we have not included in the analysis.
- C(YEAR_SOLD)[YEAR_SOLD]:C(OLD_OR_NEW)[T.OLD] shows the average difference in prices of old and new cars for the given YEAR_SOLD.
- C(YEAR_SOLD)[YEAR_SOLD]:C(OLD_OR_NEW)[NEW]:MILEAGE shows how each unit’s increase in mileage affects the price of a car which is old or new over each year.
Based on the EDA and regression analysis, here are the answers to our questions:
1. How has the time taken to sell changed over the years?
The time to sell (the difference between when the car was listed and when it was sold) increased when the pandemic started in 2020, but now it seems to have gone back to the pre-pandemic level. This is true for old (>3 years old) and new (<3 years old) used cars. However, there is a drop in the number of cars sold in 2021 and the majority is attributed to new cars.
2. How have the prices changed over the years?
Based on the analysis, we can conclude that the prices for cars have increased over the years, which is true for old and new cars. This could be due to several factors such as the pandemic, inventory issues, chip shortages, etc. Note that the price was increasing even before the pandemic started in 2020.
3. Has the difference in prices between old and new cars changed over the years?
Yes. As we can see from the visualization earlier (Chart: Price for Car Type by Year) as well as the regression analysis, the difference between old (>3 years old) and new (<3 years old) cars have increased over time. In 2021, the difference was ~2x of what it was in 2018!
4. Does mileage affect the selling price of cars differently before and after the pandemic?
Yes. It’s an interesting trend that we can see in the regression analysis. Newer cars depreciate more based on mileage than old cars.
- The depreciation due to mileage for new cars in 2021 is half of that for new cars in the previous years.
- A new car in 2021 is depreciating based on mileage at a similar rate as used cars in the previous years.
- Depreciation based on the mileage for a new car (<3 years old) in 2021 is the same as an old car (>3 years old).
In future used car data set insight analyzes, we will look into the following variables:
- Adding car body style types such as SUVs, hatchbacks, compact SUVs, coupes, etc.
- Analyzing car features such as fuel type, engine capacity, cylinders, interiors, sunroof, Android Auto, Apple CarPlay, climate control, etc., and how these affect the price of the cars.
- Building a recommendation system for predicting the appropriate price for a car.
- Creating an outlier detection system to understand overpriced cars.
- Trend and price volatility analysis to understand the best time to buy a car in the year.
For more information about our used car data, check out our webinar on QL2 Car Rental and Used Car Price Indices to learn about trends in both markets, their similarities, and differences, and insight into whether prices have peaked or continued to grow.
Written by: Akshay Munde, Data Scientist